| pudb | ||
| test | ||
| .gitignore | ||
| debug_me.py | ||
| distribute_setup.py | ||
| example-theme.py | ||
| MANIFEST.in | ||
| README.md | ||
| setup.py | ||
| try-the-debugger.sh | ||
PuDB is a full-screen, console-based visual debugger for Python.
Its goal is to provide all the niceties of modern GUI-based debuggers in a more lightweight and keyboard-friendly package. PuDB allows you to debug code right where you write and test it--in a terminal. If you've worked with the excellent (but nowadays ancient) DOS-based Turbo Pascal or C tools, PuDB's UI might look familiar.
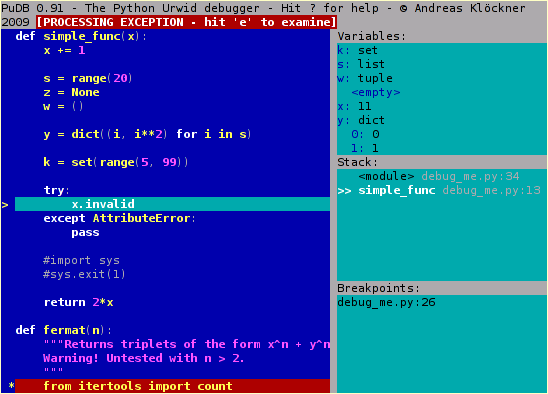
Here's a screenshot:
You may watch a screencast, too.
Features
-
Syntax-highlighted source, the stack, breakpoints and variables are all visible at once and continuously updated. This helps you be more aware of what's going on in your program. Variable displays can be expanded, collapsed and have various customization options.
-
Simple, keyboard-based navigation using single keystrokes makes debugging quick and easy. PuDB understands cursor-keys and Vi shortcuts for navigation. Other keys are inspired by the corresponding pdb coomands.
-
Use search to find relevant source code, or use "m" to invoke the module browser that shows loaded modules, lets you load new ones and reload existing ones.
-
Breakpoints can be set just by pointing at a source line and hitting "b" and then edited visually in the breakpoints window. Or hit "t" to run to the line under the cursor.
-
Drop to a Python shell in the current environment by pressing "!".
-
PuDB places special emphasis on exception handling. A post-mortem mode makes it easy to retrace a crashing program's last steps.
-
IPython integration (see wiki)
Installing
Install PuDB using the command:
easy_install pudb
Getting Started
To start debugging, simply insert:
from pudb import set_trace; set_trace()
into the piece of code you want to debug, or run the entire script with:
python -m pudb.run my-script.py
Documentation
PuDB has a wiki, where documentation and debugging wisdom are collected.
PuDB also has a mailing list that you may use to submit patches and requests for help.
Programming PuDB
At the programming language level, PuDB displays the same interface as Python's built-in pdb module. Just replace pdb with pudb. (One exception: run is called runstatement.)
License and Dependencies
PuDB is distributed under the MIT license. It relies on the following excellent pieces of software:
Development Version
You may obtain the development version using the Git version control tool.:
git clone http://git.tiker.net/trees/pudb.git
You may also browse the code online.
