IF YOU WOULD LIKE TO GET AN ACCOUNT, please write an
email to Administrator. User accounts are meant only to access repo
and report issues and/or generate pull requests.
This is a purpose-specific Git hosting for
BaseALT
projects. Thank you for your understanding!
Только зарегистрированные пользователи имеют доступ к сервису!
Для получения аккаунта, обратитесь к администратору.
Fixes https://github.com/go-gitea/gitea/issues/30005. Regression from
https://github.com/go-gitea/gitea/pull/29945.

There was only once instance of `tw-content-center` before that PR, so I
just ran below command and reverted that one instance.

```sh
perl -p -i -e 's#tw-content-center#tw-items-center#g' web_src/js/**/* templates/**/* models/**/* tests/**/*
```
Although some features are mixed together in this PR, this PR is not
that large, and these features are all related.
Actually there are more than 70 lines are for a toy "test queue", so
this PR is quite simple.
Major features:
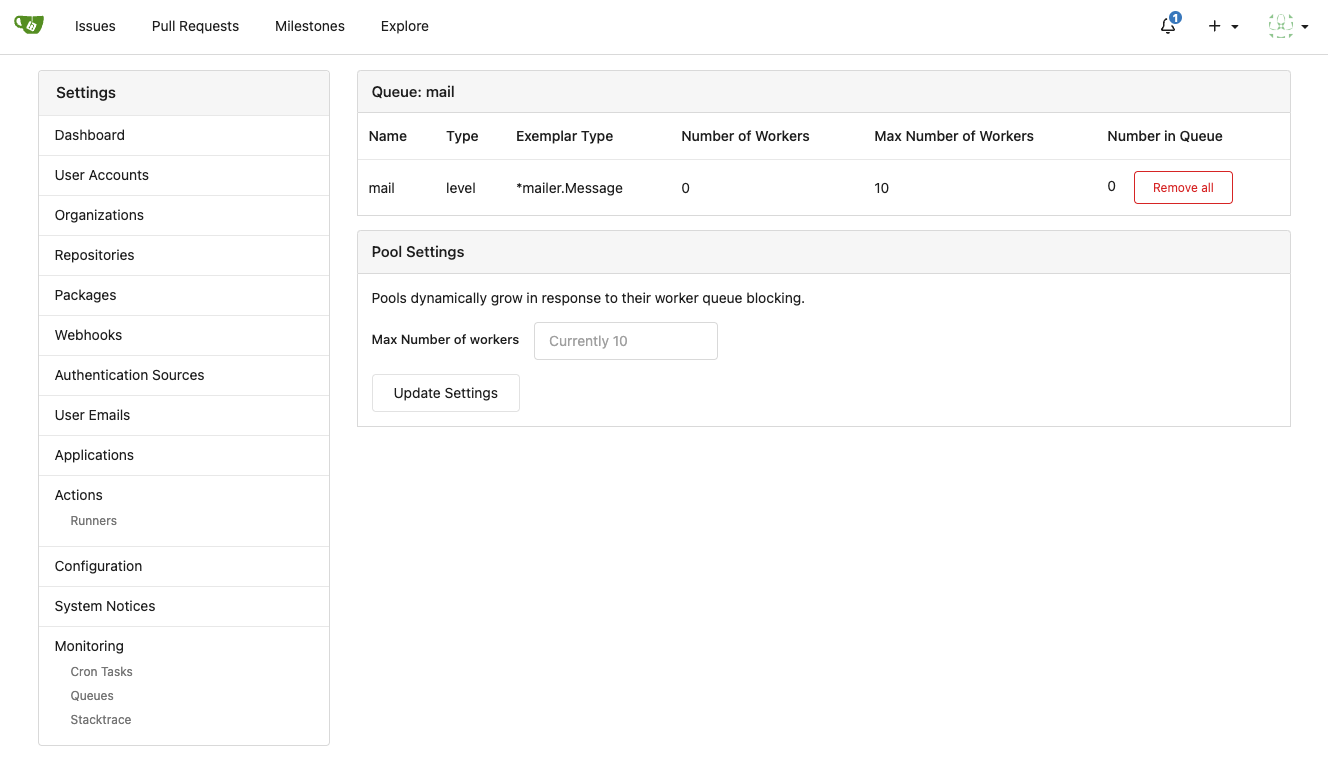
1. Allow site admin to clear a queue (remove all items in a queue)
* Because there is no transaction, the "unique queue" could be corrupted
in rare cases, that's unfixable.
* eg: the item is in the "set" but not in the "list", so the item would
never be able to be pushed into the queue.
* Now site admin could simply clear the queue, then everything becomes
correct, the lost items could be re-pushed into queue by future
operations.
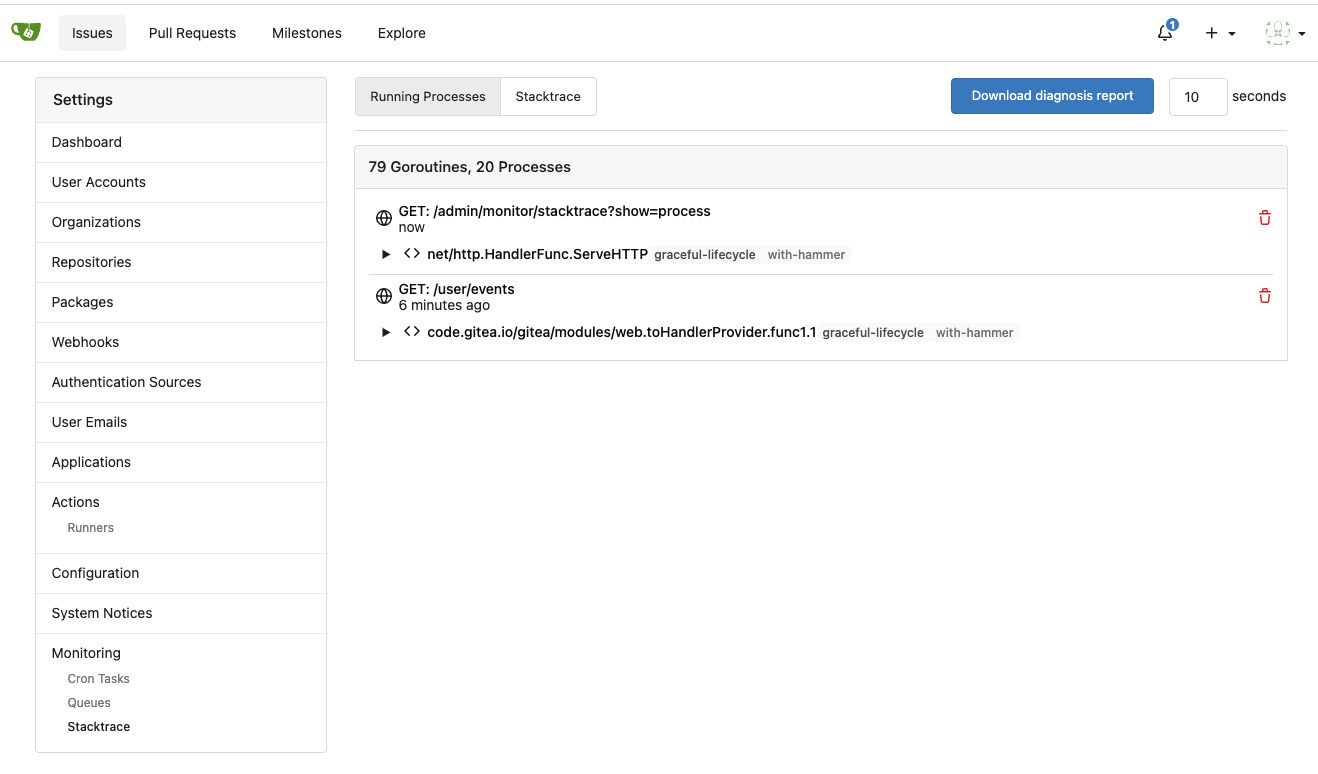
3. Split the "admin/monitor" to separate pages
4. Allow to download diagnosis report
* In history, there were many users reporting that Gitea queue gets
stuck, or Gitea's CPU is 100%
* With diagnosis report, maintainers could know what happens clearly
The diagnosis report sample:
[gitea-diagnosis-20230510-192913.zip](https://github.com/go-gitea/gitea/files/11441346/gitea-diagnosis-20230510-192913.zip)
, use "go tool pprof profile.dat" to view the report.
Screenshots:


---------
Co-authored-by: Jason Song <i@wolfogre.com>
Co-authored-by: Giteabot <teabot@gitea.io>
* Refactor `i18n` to `locale`

- Currently we're using the `i18n` variable naming for the `locale`
struct. This contains locale's specific information and cannot be used
for general i18n purpose, therefore refactoring it to `locale` makes
more sense.
- Ref: https://github.com/go-gitea/gitea/pull/20096#discussion_r906699200

* Update routers/install/install.go
* make blue really blue

* replace blue button and label classes with primary

* add --color-blue-dark

* add light color variants, tweak a few colors

* fix colors

* add comment

Co-authored-by: wxiaoguang <wxiaoguang@gmail.com>
Continues on from #19202.

Following the addition of pprof labels we can now more easily understand the relationship between a goroutine and the requests that spawn them.

This PR takes advantage of the labels and adds a few others, then provides a mechanism for the monitoring page to query the pprof goroutine profile.

The binary profile that results from this profile is immediately piped in to the google library for parsing this and then stack traces are formed for the goroutines.

If the goroutine is within a context or has been created from a goroutine within a process context it will acquire the process description labels for that process.

The goroutines are mapped with there associate pids and any that do not have an associated pid are placed in a group at the bottom as unbound.

In this way we should be able to more easily examine goroutines that have been stuck.

A manager command `gitea manager processes` is also provided that can export the processes (with or without stacktraces) to the command line.

Signed-off-by: Andrew Thornton <art27@cantab.net>